FTT vs MANA: Comparing Two Popular Cryptocurrencies in the Metaverse Ecosystem
Introduction: Investment Comparison of FTT vs MANA
In the cryptocurrency market, the comparison between FTT vs MANA has always been a topic that investors can't avoid. The two not only have significant differences in market cap ranking, application scenarios, and price performance, but also represent different cryptocurrency asset positioning.
FTT (FTT): Since its launch in 2019, it has gained market recognition as the native token of the FTX exchange ecosystem.
MANA (MANA): Introduced in 2017, it has been hailed as a pioneer in blockchain-based virtual worlds, representing one of the earliest forays into the metaverse concept.
This article will comprehensively analyze the investment value comparison between FTT and MANA, focusing on historical price trends, supply mechanisms, institutional adoption, technological ecosystems, and future predictions, attempting to answer the question investors care about most:
"Which is the better buy right now?"
I. Price History Comparison and Current Market Status
FTT and MANA Historical Price Trends
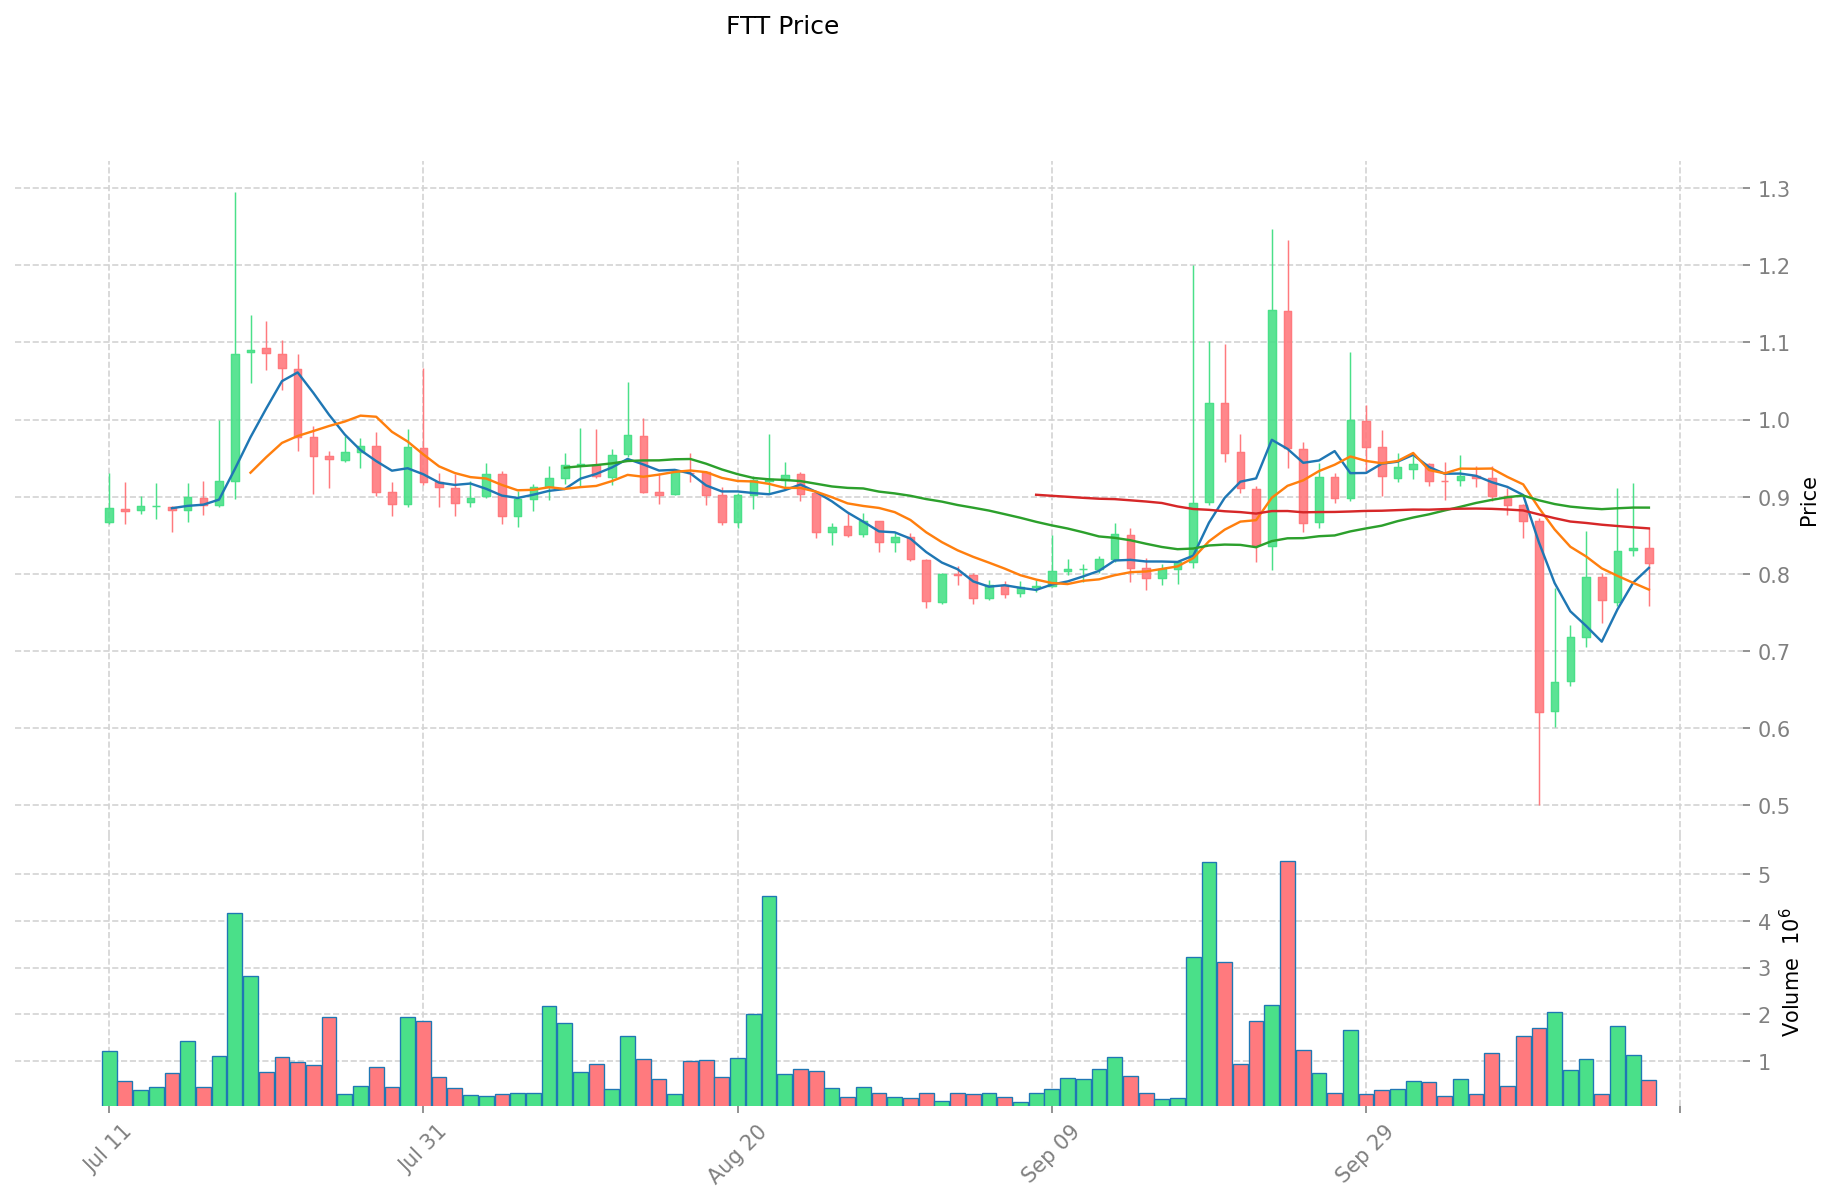
- 2021: FTT reached its all-time high of $84.18 on September 10, 2021.
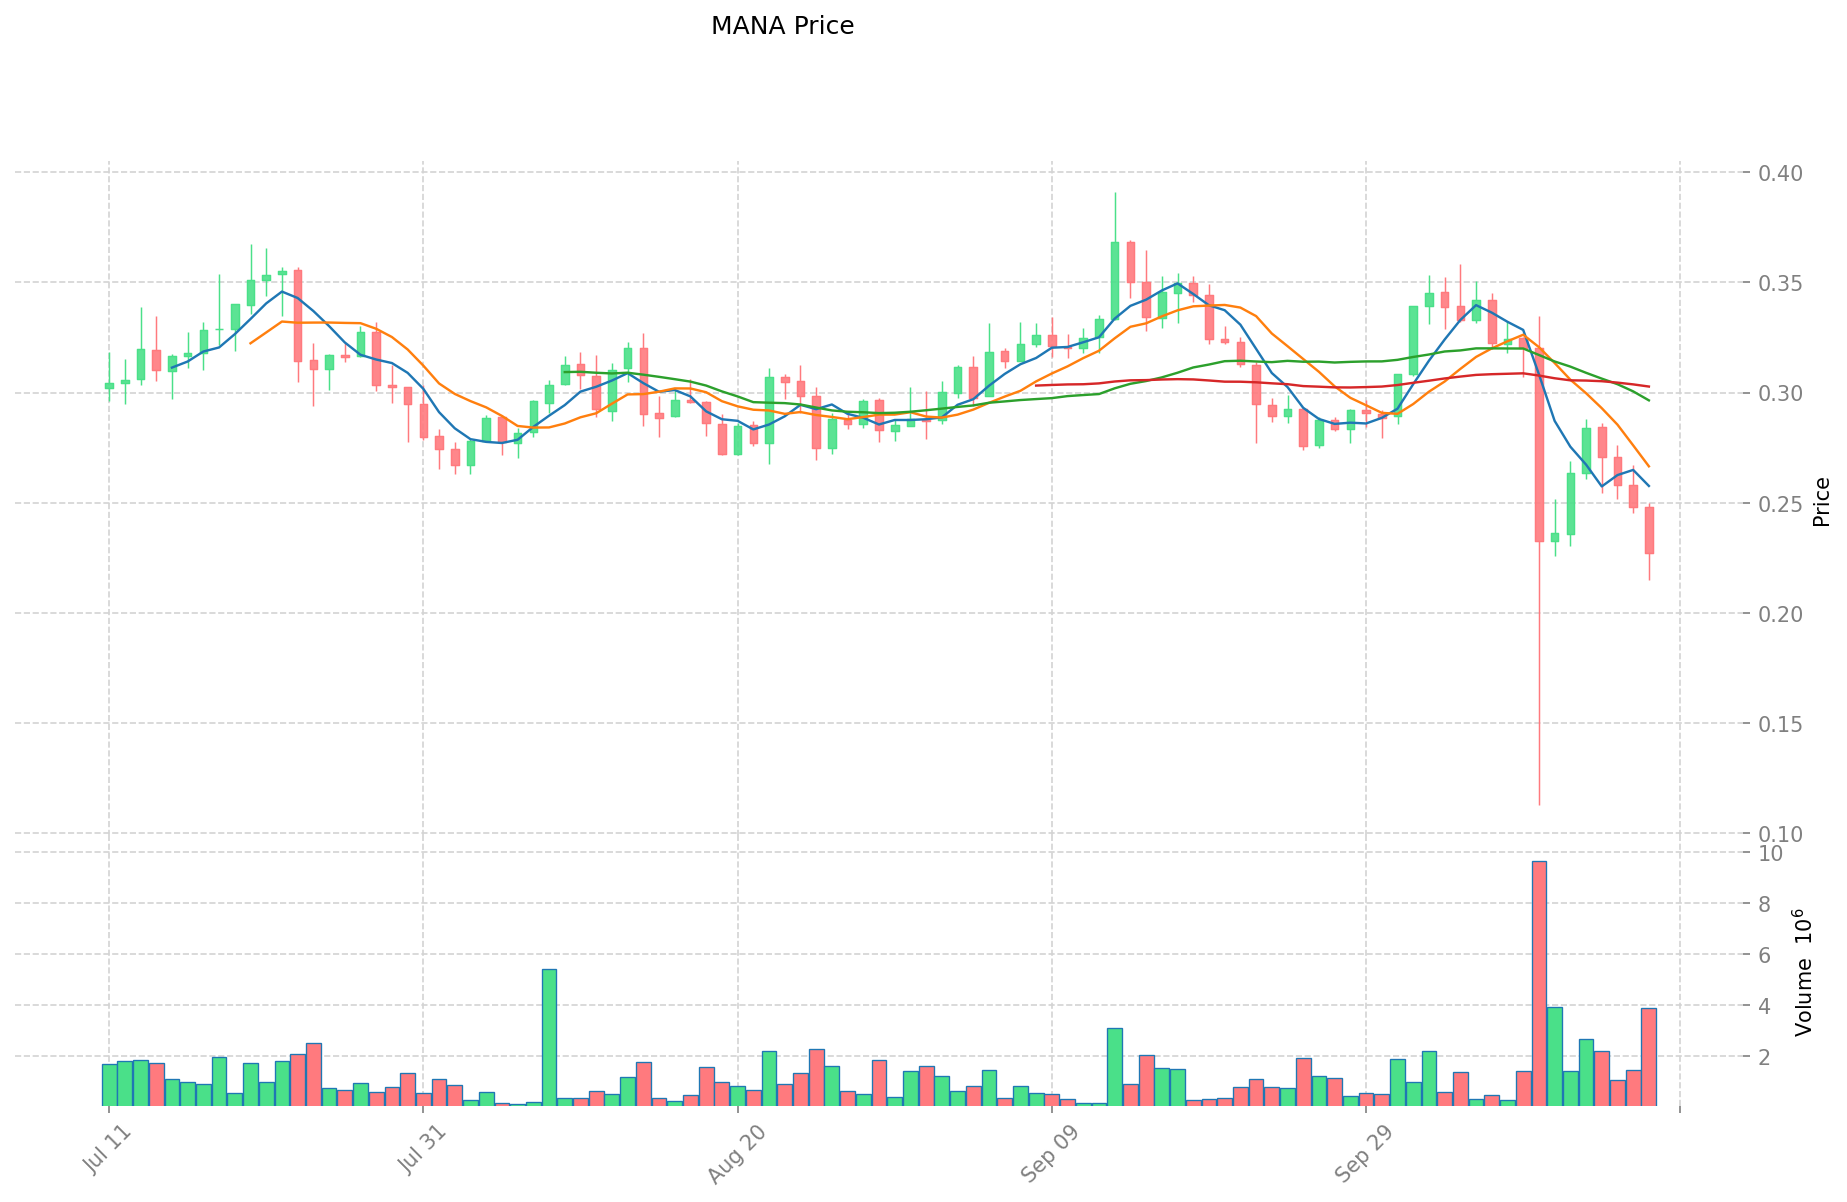
- 2021: MANA hit its record high of $5.85 on November 25, 2021, likely due to the metaverse hype.
- Comparative Analysis: In the recent market cycle, FTT has fallen from its peak of $84.18 to a low of $0.536571, while MANA dropped from $5.85 to a current price of $0.2271.
Current Market Situation (2025-10-18)
- FTT current price: $0.8129
- MANA current price: $0.2271
- 24-hour trading volume: FTT $472,583.61 vs MANA $890,324.37
- Market Sentiment Index (Fear & Greed Index): 22 (Extreme Fear)
Click to view real-time prices:
- Check FTT current price Market Price
- Check MANA current price Market Price
II. Core Factors Affecting the Investment Value of FTT vs MANA
Supply Mechanism Comparison (Tokenomics)
- FTT: Limited supply with token burning mechanism through FTX exchange profits
- MANA: Fixed maximum supply of 2.19 billion tokens with deflationary mechanism through land purchases in Decentraland
- 📌 Historical Pattern: Deflationary models tend to support long-term price appreciation when paired with growing utility and demand.
Institutional Adoption and Market Applications
- Institutional Holdings: MANA has attracted more diverse institutional interest through metaverse exposure, while FTT was primarily concentrated within the FTX ecosystem
- Enterprise Adoption: MANA has secured partnerships with major brands for metaverse presence, while FTT utility was largely limited to the now-defunct FTX exchange
- National Policies: Regulatory scrutiny of exchange tokens increased following the FTX collapse, while metaverse tokens face less direct regulatory pressure
Technical Development and Ecosystem Building
- FTT Technical Development: Development effectively ceased following the FTX collapse
- MANA Technical Development: Ongoing development of the Decentraland platform with regular updates to improve user experience and functionality
- Ecosystem Comparison: MANA supports an active NFT marketplace, virtual land economy, and creator economy within Decentraland, while FTT's ecosystem collapsed with FTX
Macroeconomic and Market Cycles
- Performance in Inflationary Environment: MANA offers potential digital real estate exposure as an inflation hedge, while FTT lacks intrinsic value mechanisms
- Macroeconomic Monetary Policy: Interest rate changes affect speculative assets like MANA, though it has maintained better relative market positioning than FTT
- Geopolitical Factors: Growing global interest in virtual worlds and digital ownership benefits MANA's long-term positioning in international markets
III. 2025-2030 Price Prediction: FTT vs MANA
Short-term Prediction (2025)
- FTT: Conservative $0.496052 - $0.8132 | Optimistic $0.8132 - $0.878256
- MANA: Conservative $0.117884 - $0.2267 | Optimistic $0.2267 - $0.285642
Mid-term Prediction (2027)
- FTT may enter a growth phase, with estimated prices ranging from $0.5846517664 to $1.0561451264
- MANA may enter a bullish market, with estimated prices ranging from $0.17303070195 to $0.37338204105
- Key drivers: Institutional capital inflow, ETF, ecosystem development
Long-term Prediction (2030)
- FTT: Base scenario $0.733271565600288 - $1.12811010092352 | Optimistic scenario $1.12811010092352 - $1.218358908997401
- MANA: Base scenario $0.288642440420959 - $0.481070734034932 | Optimistic scenario $0.481070734034932 - $0.553231344140172
Disclaimer: This analysis is based on historical data and market trends. Cryptocurrency markets are highly volatile and unpredictable. These predictions should not be considered as financial advice. Always conduct your own research before making investment decisions.
FTT:
| 年份 | 预测最高价 | 预测平均价格 | 预测最低价 | 涨跌幅 |
|---|---|---|---|---|
| 2025 | 0.878256 | 0.8132 | 0.496052 | 0 |
| 2026 | 1.04024544 | 0.845728 | 0.43132128 | 4 |
| 2027 | 1.0561451264 | 0.94298672 | 0.5846517664 | 16 |
| 2028 | 1.159496470912 | 0.9995659232 | 0.829639716256 | 22 |
| 2029 | 1.17668900479104 | 1.079531197056 | 0.68010465414528 | 32 |
| 2030 | 1.218358908997401 | 1.12811010092352 | 0.733271565600288 | 38 |
MANA:
| 年份 | 预测最高价 | 预测平均价格 | 预测最低价 | 涨跌幅 |
|---|---|---|---|---|
| 2025 | 0.285642 | 0.2267 | 0.117884 | 0 |
| 2026 | 0.35095427 | 0.256171 | 0.14857918 | 12 |
| 2027 | 0.37338204105 | 0.303562635 | 0.17303070195 | 33 |
| 2028 | 0.45016820957325 | 0.338472338025 | 0.324933444504 | 49 |
| 2029 | 0.56782119427074 | 0.394320273799125 | 0.354888246419212 | 73 |
| 2030 | 0.553231344140172 | 0.481070734034932 | 0.288642440420959 | 111 |
IV. Investment Strategy Comparison: FTT vs MANA
Long-term vs Short-term Investment Strategy
- FTT: Suitable for investors focused on speculative recovery plays and high-risk opportunities
- MANA: Suitable for investors interested in metaverse potential and digital asset exposure
Risk Management and Asset Allocation
- Conservative investors: FTT: 0% vs MANA: 5%
- Aggressive investors: FTT: 1% vs MANA: 10%
- Hedging tools: Stablecoin allocation, options, cross-currency portfolio
V. Potential Risk Comparison
Market Risk
- FTT: Extreme volatility due to uncertain future and lack of underlying utility
- MANA: Susceptible to metaverse hype cycles and overall crypto market sentiment
Technical Risk
- FTT: Lack of ongoing development, potential for complete loss of value
- MANA: Scalability challenges, platform stability issues
Regulatory Risk
- Global regulatory policies may impact MANA less directly than exchange tokens like FTT
VI. Conclusion: Which Is the Better Buy?
📌 Investment Value Summary:
- FTT advantages: Potential for speculative gains if exchange assets are recovered
- MANA advantages: Active ecosystem development, metaverse exposure, brand partnerships
✅ Investment Advice:
- New investors: Consider small MANA allocation for metaverse exposure, avoid FTT
- Experienced investors: MANA may offer better risk-adjusted potential; FTT only for high-risk portfolios
- Institutional investors: MANA could provide diversified metaverse exposure; FTT generally not recommended
⚠️ Risk Warning: Cryptocurrency markets are highly volatile. This article does not constitute investment advice. None
VII. FAQ
Q1: What are the key differences between FTT and MANA? A: FTT was the native token of the FTX exchange, while MANA is the currency of the Decentraland metaverse. FTT's ecosystem collapsed with FTX, whereas MANA continues to support an active virtual world with ongoing development.
Q2: Which token has shown better price stability? A: MANA has demonstrated better price stability compared to FTT. While both have experienced significant drops from their all-time highs, FTT has fallen more dramatically due to the FTX collapse.
Q3: How do the future prospects differ for FTT and MANA? A: MANA has more positive future prospects due to ongoing development of the Decentraland platform and growing interest in metaverse technologies. FTT's future is highly uncertain with limited utility and no active development.
Q4: What are the main risks associated with investing in FTT vs MANA? A: FTT carries extreme risk due to its association with the collapsed FTX exchange and lack of ongoing development. MANA's risks are more typical of cryptocurrency investments, including market volatility and potential regulatory challenges for metaverse projects.
Q5: How do institutional investors view FTT compared to MANA? A: Institutional investors generally view MANA more favorably due to its exposure to the metaverse sector and ongoing partnerships. FTT is largely avoided by institutions following the FTX collapse.
Q6: What allocation would be recommended for conservative vs aggressive investors? A: Conservative investors might consider 0% FTT and up to 5% MANA, while aggressive investors might allocate 1% to FTT (as a high-risk play) and up to 10% to MANA.
Q7: How do the tokenomics of FTT and MANA compare? A: MANA has a fixed maximum supply with a deflationary mechanism through land purchases in Decentraland. FTT had a limited supply with a token burning mechanism, but this is no longer active due to the FTX collapse.
Share
Content