2025 GRT Price Prediction: Analyzing the Graph's Potential in the Web3 Ecosystem
Introduction: GRT's Market Position and Investment Value
The Graph (GRT), as a decentralized protocol for indexing and querying blockchain data, has made significant strides since its inception in 2020. As of 2025, The Graph's market capitalization has reached $722,105,571, with a circulating supply of approximately 10,526,531,586 tokens, and a price hovering around $0.06686. This asset, often referred to as the "Google of blockchains," is playing an increasingly crucial role in making blockchain data easily accessible and queryable.
This article will provide a comprehensive analysis of The Graph's price trends from 2025 to 2030, considering historical patterns, market supply and demand, ecosystem development, and macroeconomic factors, to offer professional price predictions and practical investment strategies for investors.
I. GRT Price History Review and Current Market Status
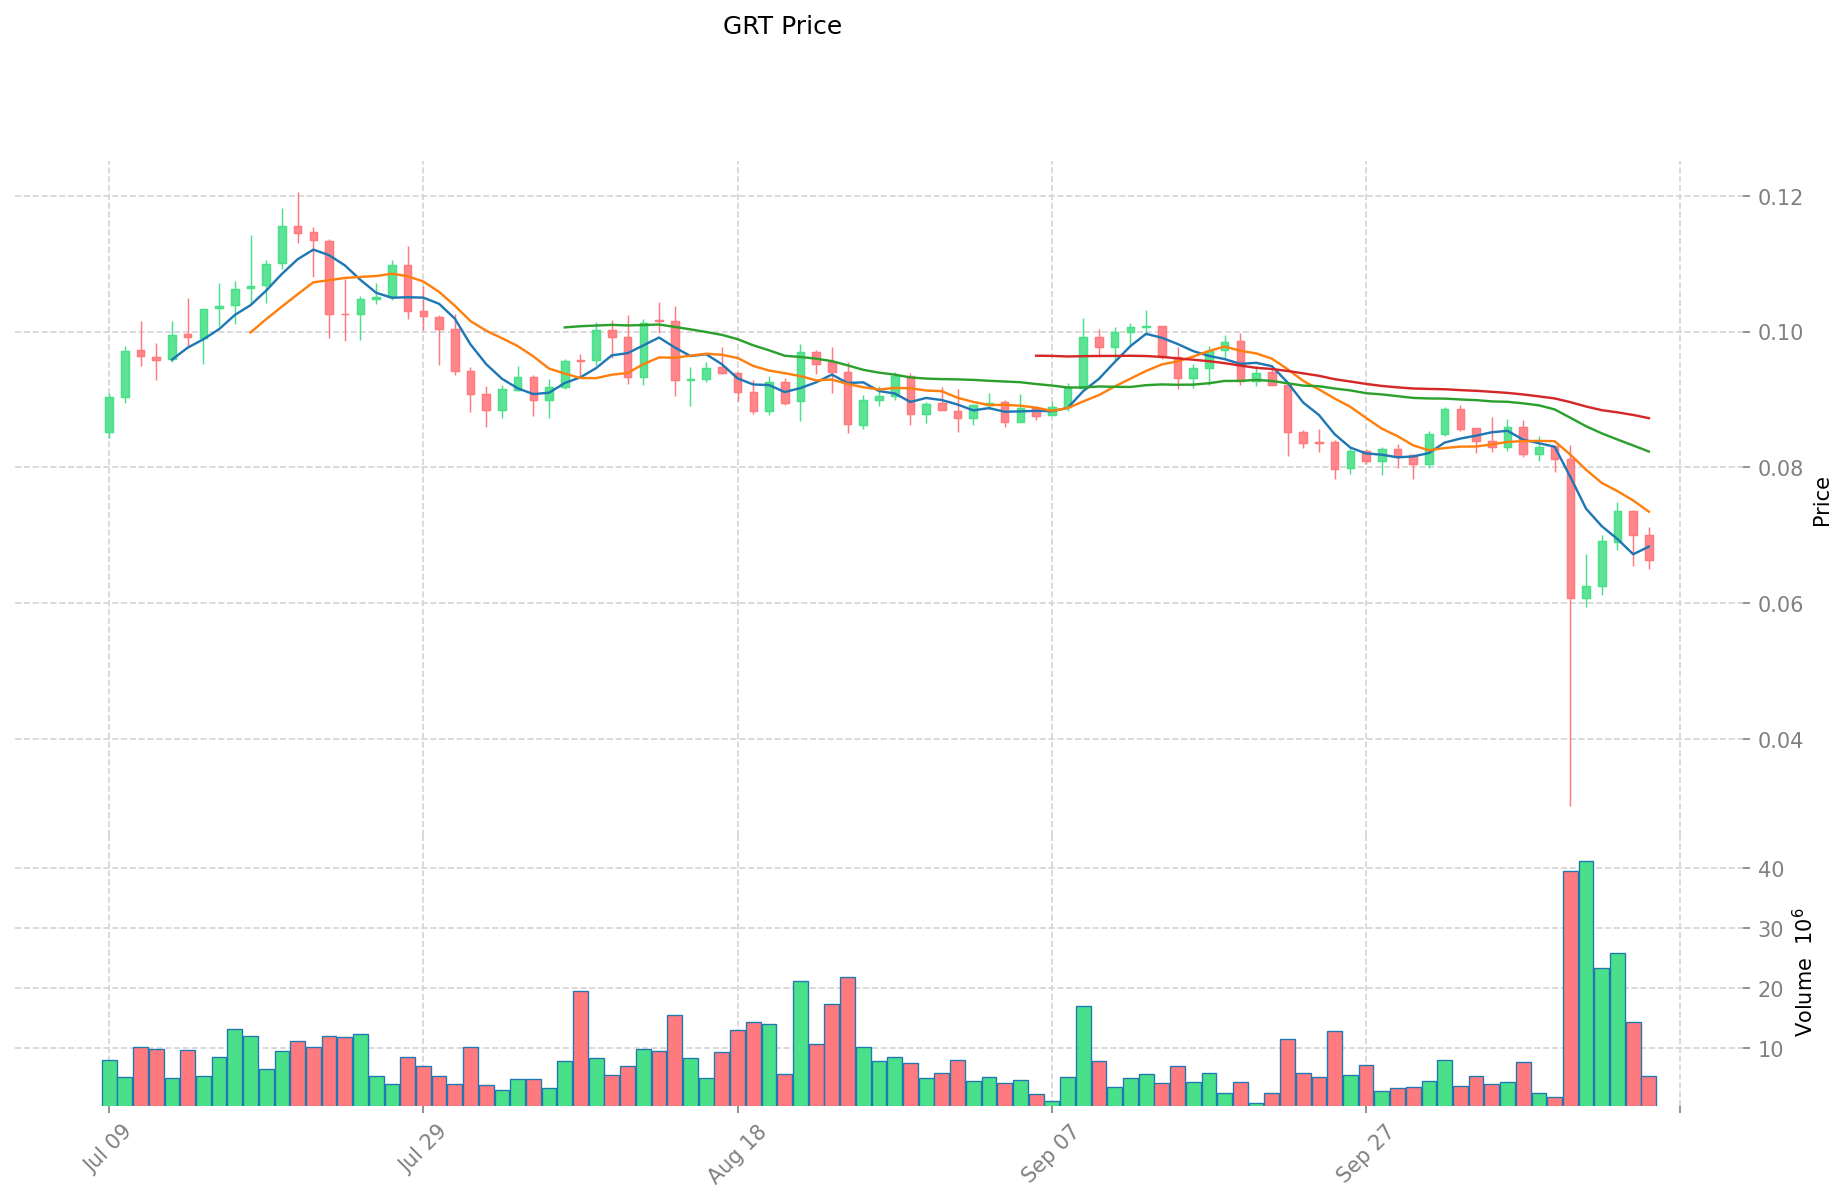
GRT Historical Price Evolution
- 2020: GRT launched at $0.03, price surged to $0.17 within days
- 2021: Reached all-time high of $2.84 in February amid crypto bull market
- 2022-2024: Declined during bear market, bottoming at $0.05 range
GRT Current Market Situation
As of October 16, 2025, GRT is trading at $0.06686, down 4.25% in the last 24 hours. The token has experienced significant volatility, with a 7-day decline of 18.59% and a 30-day drop of 27.36%. GRT's market cap stands at $703,803,901, ranking it 116th among cryptocurrencies. The current price represents a 97.65% decrease from its all-time high of $2.84, set on February 12, 2021. Trading volume in the past 24 hours is $357,224, indicating moderate market activity. The token's circulating supply is 10,526,531,586 GRT, which is 97.47% of its total supply of 10,800,262,816 GRT.
Click to view current GRT market price
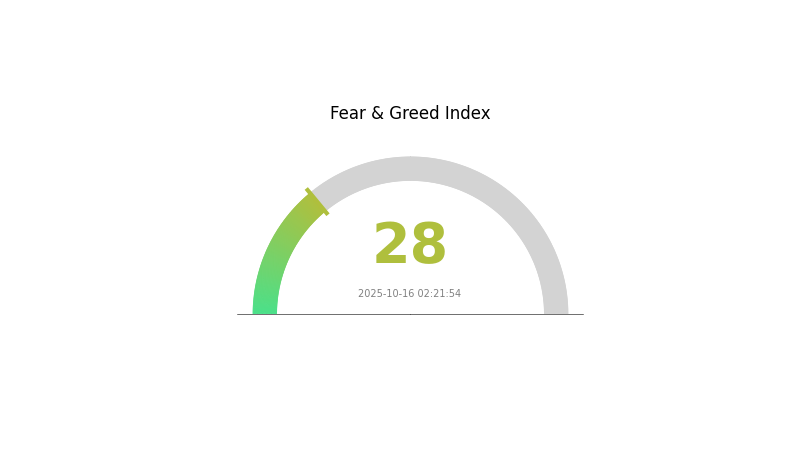
GRT Market Sentiment Indicator
2025-10-16 Fear and Greed Index: 28 (Fear)
Click to view the current Fear & Greed Index
The crypto market is showing signs of fear, with the Fear and Greed Index at 28. This indicates a cautious sentiment among investors. During such periods, some traders may see it as an opportunity to accumulate, following the adage "be greedy when others are fearful." However, it's crucial to conduct thorough research and consider your risk tolerance before making any investment decisions. Gate.com offers various tools and resources to help navigate these market conditions effectively.
GRT Holdings Distribution
The address holdings distribution data for GRT reveals a significant concentration of tokens among a few top addresses. The largest holder possesses 26.82% of the total supply, with the top 5 addresses collectively controlling 45.67% of all GRT tokens. This concentration pattern suggests a relatively centralized ownership structure within the GRT ecosystem.
Such a distribution raises concerns about potential market manipulation and price volatility. With nearly half of the tokens held by just five addresses, there's a risk that large-scale buying or selling activities by these major holders could significantly impact GRT's market price. This concentration also implies that a small number of entities have substantial influence over the network's governance and decision-making processes.
Despite these concerns, it's noteworthy that over 54% of GRT tokens are distributed among other addresses, indicating some level of decentralization. However, the current holdings distribution suggests that GRT's on-chain structure may be vulnerable to centralized control, potentially affecting its long-term stability and resistance to market shocks.
Click to view the current GRT Holdings Distribution
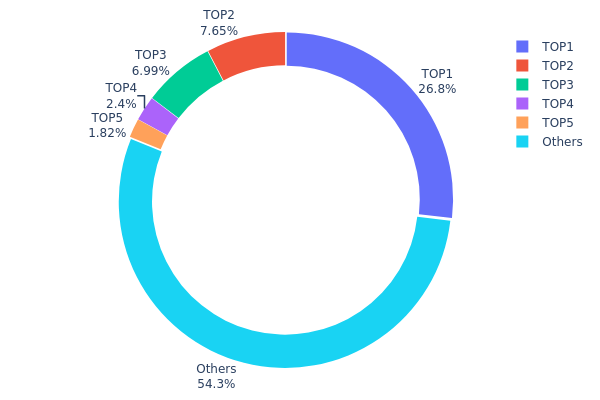
| Top | Address | Holding Qty | Holding (%) |
|---|---|---|---|
| 1 | 0x36af...77f090 | 2897510.24K | 26.82% |
| 2 | 0x32ec...7f2ca1 | 826666.67K | 7.65% |
| 3 | 0x823f...27396c | 754552.00K | 6.98% |
| 4 | 0xf977...41acec | 259647.12K | 2.40% |
| 5 | 0xf550...1263b9 | 197090.70K | 1.82% |
| - | Others | 5864796.09K | 54.33% |
II. Key Factors Influencing GRT's Future Price
Supply Mechanism
- Market Dynamics: The supply and demand dynamics play a crucial role in influencing GRT's price.
- Current Impact: The ongoing market demand and strong investor interest have contributed to GRT's price momentum.
Institutional and Whale Movements
- Enterprise Adoption: Increasing adoption of decentralized applications requiring reliable and efficient data query and indexing services could potentially drive demand for GRT.
Macroeconomic Environment
- Geopolitical Factors: International situations and overall market conditions can impact GRT's price movement.
Technological Development and Ecosystem Building
- Network Advancements: Technological progress in The Graph network can influence GRT's price.
- Ecosystem Applications: The growth of decentralized applications relying on The Graph's services may affect GRT's value.
- Competitive Landscape: The Graph faces competition from other decentralized indexing protocols, which could impact its market share and price if it fails to maintain its technological edge.
III. GRT Price Prediction for 2025-2030
2025 Outlook
- Conservative prediction: $0.06468 - $0.06668
- Neutral prediction: $0.06668 - $0.07000
- Optimistic prediction: $0.07000 - $0.07201 (requires positive market sentiment)
2027-2028 Outlook
- Market phase expectation: Potential growth phase
- Price range forecast:
- 2027: $0.0603 - $0.09534
- 2028: $0.07338 - $0.11758
- Key catalysts: Increased adoption of The Graph protocol, overall crypto market recovery
2029-2030 Long-term Outlook
- Base scenario: $0.103 - $0.11948 (assuming steady growth in blockchain data indexing demand)
- Optimistic scenario: $0.13596 - $0.15771 (assuming rapid expansion of The Graph ecosystem)
- Transformative scenario: $0.15771+ (extreme favorable conditions such as widespread enterprise adoption)
- 2030-12-31: GRT $0.15771 (potential peak price based on optimistic projections)
| 年份 | 预测最高价 | 预测平均价格 | 预测最低价 | 涨跌幅 |
|---|---|---|---|---|
| 2025 | 0.07201 | 0.06668 | 0.06468 | 0 |
| 2026 | 0.09362 | 0.06935 | 0.06172 | 3 |
| 2027 | 0.09534 | 0.08148 | 0.0603 | 21 |
| 2028 | 0.11758 | 0.08841 | 0.07338 | 32 |
| 2029 | 0.13596 | 0.103 | 0.07725 | 54 |
| 2030 | 0.15771 | 0.11948 | 0.0693 | 78 |
IV. GRT Professional Investment Strategies and Risk Management
GRT Investment Methodology
(1) Long-term Holding Strategy
- Suitable for: Long-term investors with high risk tolerance
- Operation suggestions:
- Accumulate GRT during market dips
- Stake GRT to earn rewards and participate in network governance
- Store in non-custodial wallets for enhanced security
(2) Active Trading Strategy
- Technical analysis tools:
- Moving Averages: Use to identify trends and potential entry/exit points
- Relative Strength Index (RSI): Gauge overbought/oversold conditions
- Key points for swing trading:
- Monitor The Graph ecosystem developments and partnerships
- Pay attention to overall crypto market sentiment
GRT Risk Management Framework
(1) Asset Allocation Principles
- Conservative investors: 1-3% of crypto portfolio
- Aggressive investors: 5-10% of crypto portfolio
- Professional investors: Up to 15% of crypto portfolio
(2) Risk Hedging Solutions
- Diversification: Spread investments across multiple crypto assets
- Stop-loss orders: Set predetermined exit points to limit potential losses
(3) Secure Storage Solutions
- Hot wallet recommendation: Gate Web3 Wallet
- Cold storage solution: Hardware wallets for long-term holdings
- Security precautions: Enable two-factor authentication, use strong passwords
V. Potential Risks and Challenges for GRT
GRT Market Risks
- High volatility: Cryptocurrency markets are known for rapid price fluctuations
- Competition: Emerging indexing protocols may challenge The Graph's market position
- Token dilution: Potential inflation due to token release schedules
GRT Regulatory Risks
- Uncertain regulatory landscape: Evolving crypto regulations may impact GRT's utility
- Cross-border compliance: Varying international regulations may limit adoption
- SEC scrutiny: Potential classification as a security could affect trading and usage
GRT Technical Risks
- Smart contract vulnerabilities: Potential bugs or exploits in The Graph's codebase
- Scalability challenges: Increasing network usage may lead to performance issues
- Dependency on Ethereum: The Graph's core functionality relies on Ethereum's ecosystem
VI. Conclusion and Action Recommendations
GRT Investment Value Assessment
The Graph (GRT) presents a compelling long-term value proposition as a crucial infrastructure for Web3 data indexing. However, short-term price volatility and regulatory uncertainties pose significant risks.
GRT Investment Recommendations
✅ Beginners: Start with small, regular investments to understand the technology and market dynamics ✅ Experienced investors: Consider a balanced approach of staking and active trading based on technical analysis ✅ Institutional investors: Explore strategic partnerships and large-scale indexing opportunities within The Graph ecosystem
GRT Participation Methods
- Token purchase: Acquire GRT through Gate.com's spot market
- Staking: Participate in network security and earn rewards by delegating to indexers
- Ecosystem involvement: Contribute to The Graph's development or create subgraphs for data indexing
Cryptocurrency investments carry extremely high risks, and this article does not constitute investment advice. Investors should make decisions carefully based on their own risk tolerance and are advised to consult professional financial advisors. Never invest more than you can afford to lose.
FAQ
Can grt coin reach $10?
Yes, GRT could potentially reach $10 by 2030 if current market trends continue. However, it's unlikely to hit this price point by 2025 based on current projections.
Does GRT have a future?
Yes, GRT has a promising future. The Graph's recent upgrade enables cross-chain bridging, with plans for cross-chain staking and query fee payments, indicating continued growth and integration in the Web3 ecosystem.
Will GRT reach $2?
Based on current predictions, GRT may reach $2 by 2030. Analysts forecast a price of $0.10 in 2025, with potential to hit $4.68 by 2033. However, crypto markets are highly volatile.
How high can GRT go in 2025?
Based on forecasts, GRT could reach an average price of $0.064956433 in 2025, with a potential minimum of $0.06328131. However, current prices are already higher than these predictions.
Share
Content